

In late April, the domestic acrylic acid market saw an end to the one-sided surge witnessed in March. Amidst the interplay of multiple factors—including falling raw material costs, increased industry supply, insufficient downstream demand, and shifts in the import-export structure—the market as a whole exhibited a softening at high levels, followed by a sustained downward trend. Based on SunSirs’ official benchmark price of 21 April, the price transmission logic between upstream and downstream sectors and the market dynamics are summarized as follows.
I. Price Trends for Core Products (21 April, SunSirs Benchmark Price)
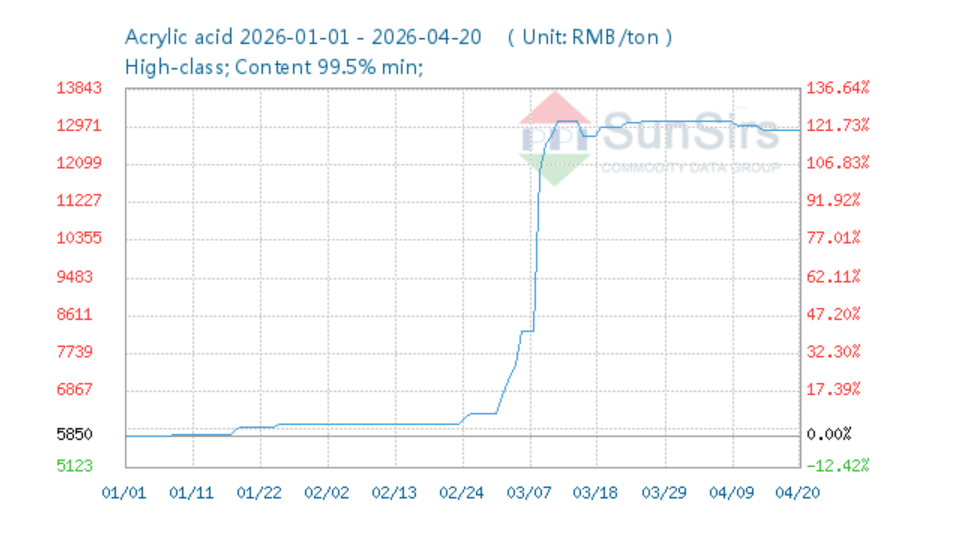
Acrylic Acid (Premium Grade)
Benchmark price on 21 April: 12,766.67 RMB/ton
Compared to 1 April (13,116.67 RMB/ton): -2.67%
Compared to 1 March (11,250.00 RMB/ton): +13.48%
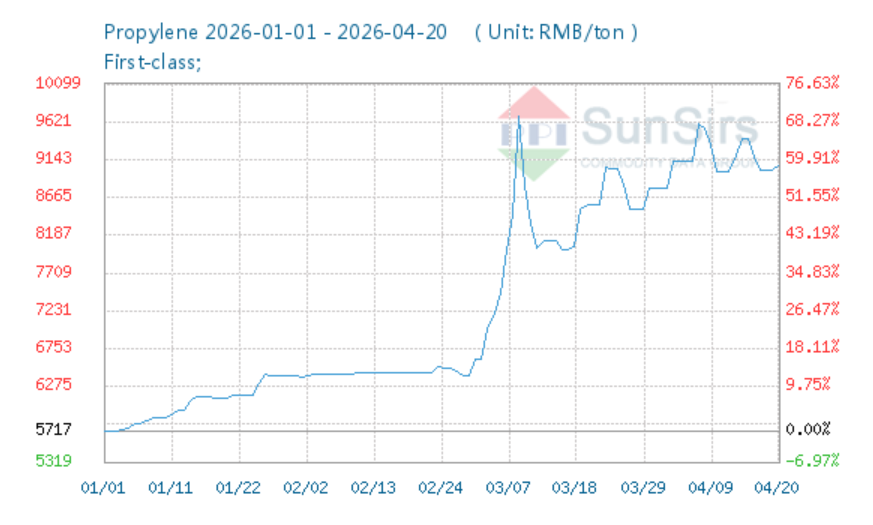
Propylene (key raw material for acrylic acid)
21 April benchmark price: 9,015.33 RMB/ton
Compared to 1 April (8,784.33 RMB/ton): +2.63%
Compared to 1 March (8,126.67 RMB/ton): +10.94%
Butanol (raw material for acrylic esters)
21 April benchmark price: 11,240.00 RMB/ton
Compared to 1 April: -1.85%
Compared to 1 March: +9.22%
Butyl Acrylate (Core Downstream Product)
Market price on 21 April: 15,833.33 RMB/tonne
Compared to 1 April: -2.19%
Compared to 1 March: +11.75%
II. Key Drivers Behind Upstream and Downstream Price Movements
1. Cost Side: Raw materials stabilize at high levels, with marginal weakening of cost support
Propylene is the sole core raw material for acrylic acid production, accounting for over 75% of costs. In March, propylene prices continued to rise driven by stronger crude oil prices, pulling acrylic acid prices up sharply. Since April, propylene prices have fluctuated slightly at high levels, with overall upward momentum waning. The impetus for rising raw material costs has faded, and the strong support for acrylic acid has gradually weakened marginally.
Earlier price increases for acrylic acid had significantly outpaced the rise in raw material costs, with industry profits at historic highs, creating an inherent need for a price correction. Going forward, the scope for raw material price fluctuations is limited; they will only provide basic support at the bottom of the market and are unlikely to drive another significant rise in acrylic acid prices.
2. Supply Side: Profit-Driven Increase in Operating Rates, Continued Abundant Market Supply
The sharp rise in acrylic acid prices in March generated substantial profits, leading to a comprehensive increase in industry production enthusiasm. In April, the industry’s overall operating rate rose to over **82%**, with facilities previously undergoing maintenance gradually resuming production. Domestic output has been steadily increasing, and spot market supplies remain ample.
Accumulated inventory from earlier periods is gradually flowing into the futures market, and manufacturers are facing mounting pressure to offload stock. Competition for market supply has intensified, and firms are gradually lowering their quoted prices to accelerate destocking, which has become the direct supply-side driver for the price decline. There is no pressure from new capacity coming online; the market is primarily driven by high-load utilization of existing capacity.
3. Demand Side: Weak downstream absorption; high prices suppress end-user procurement
Overall demand in downstream sectors such as acrylic esters, water treatment, adhesives and coatings remains subdued. Affected by the high cost of acrylic acid, cost pressures on downstream products have surged, and the end-user market has shown low acceptance of high-priced raw materials.
Downstream enterprises have generally adopted a strategy of purchasing small orders on an as-needed basis and maintaining low inventory levels, with a significant lack of willingness to restock in bulk; overall market transactions remain sluggish. The demand side is unable to absorb the high upstream prices, creating a clear downward pressure; price transmission along the industrial chain is hindered, further forcing acrylic acid prices to correct.
III. The Import and Export Market Landscape in 2026
According to official monthly statistics from the General Administration of Customs, the import and export landscape for acrylic acid showed significant divergence between January and March 2026.
On the export front, the advantage of domestic production capacity was evident, with cumulative exports reaching 113,600 tonnes, a substantial year-on-year increase of 31.4%. Southeast Asia and India were the primary export destinations, with overseas demand in the early period supporting the domestic market. Entering April, high domestic prices coupled with intensified competition from international supplies led to a marginal contraction in new export orders, and the positive support from foreign trade gradually weakened.
Regarding imports, cumulative imports stood at 18,200 tonnes, a year-on-year decline of 22.7%. As domestic self-sufficiency rates continued to rise and the inflow of low-priced overseas supplies remained limited, the impact of imports on the domestic market was relatively minor. Overall, the impact of foreign trade has shifted from strong support in the earlier period to a neutral stance, making it difficult to continue driving domestic prices upwards.
IV. Overall Market Landscape and Outlook
Profits within the industry chain are gradually shifting moderately from the upstream acrylic acid segment to the downstream sector; profitability in upstream production has narrowed somewhat, whilst cost pressures in the downstream sector have eased slightly.
In the short term, acrylic acid prices are expected to continue fluctuating at high levels, with support from raw material costs providing a floor.
Post time: May-07-2026


